
Published on June 11, 2024 by Vivek Singhal
Introduction
Card payment analytics have evolved significantly since their inception. Initially focused on basic transaction tracking, they have matured into a sophisticated tool for extracting actionable insights from credit and debit card data. With the rise of big data and AI, these analytics now anticipate trends, aiding businesses in personalised marketing, fraud detection and seamless customer experiences. The future promises even deeper integration with emerging technologies such as blockchain and IoT, revolutionising payment analytics.
Tracing the journey
-
Early systems:
Transactions before the 20th century relied on cash and checks, with basic record-keeping.
-
Electronic payment systems:
The 20th century saw the introduction of credit cards for simple tracking.
-
Data processing era:
Computers enabled larger-scale data collection and batch processing to gain insights.
-
Emergence of POS systems:
POS systems in the 1980s-90s enabled detailed data generation for segmentation and marketing.
-
Online payments and e-commerce:
Growth in the use of the internet led to advanced analytics such as machine learning for fraud detection and customer experience enhancement.
-
Mobile payments and digital wallets:
The rise of smartphones expanded analytics to include mobile transaction data and user behaviour.
-
Blockchain and cryptocurrency:
The emergence of blockchain technology introduced new challenges, requiring specialised analytics for decentralised transactions.
Evolution of payment analytics
In the late 20th century, businesses recognised the importance of analysing payment data to gain a competitive advantage as transactions shifted from paper to digital formats, enabling more complex analytics. Early systems focused on basic reporting and transaction reconciliation.
With the advent of the 21st-century digital revolution, numerous payment channels emerged, prompting payment analytics to evolve with real-time monitoring and advanced reporting tools. Enterprises began using data to understand customer preferences, paving the way for personalised commerce strategies.
The contemporary outlook: real-time monitoring and understanding the customer
In today's landscape, payment analytics encompass real-time monitoring, fraud detection and customer behaviour analysis. Businesses rely on advanced algorithms and machine learning to detect anomalies and improve security measures. The emergence of contactless payments, mobile wallets and diverse digital platforms has heightened the intricacy of payment data, highlighting the critical role of analytics.
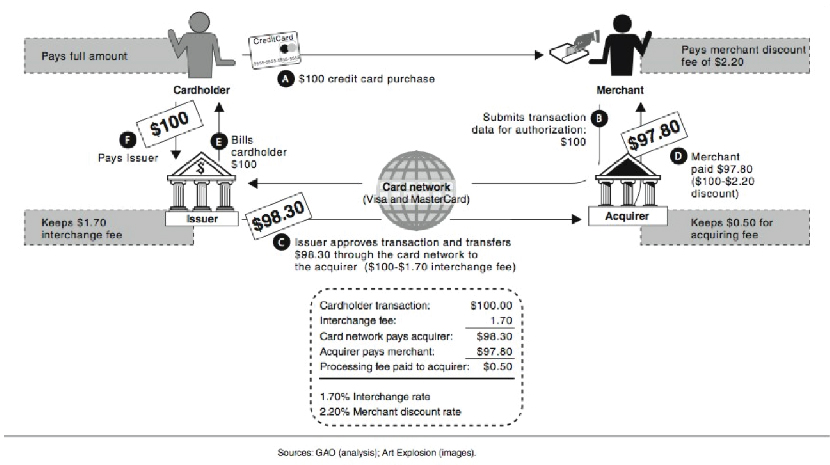
How card transactions work
A credit/debit card transaction at a merchant entails a basic calculation of revenue to the payment processor:
Discount - Interchange - Assessment = Revenue
Discount: Payment processors charge merchants a percentage fee for handling card transactions.
Interchange: Fees paid between banks for card transactions, set by card networks based on transaction specifics.
Assessment: Fees levied by card networks on banks to maintain infrastructure, often a percentage of transaction volume.
A typical example of transfer fees in a credit card transaction
Financial institutions also generate revenue from the following:
-
Other fees: Miscellaneous charges for card processing, such as gateway or chargeback fees.
-
Equipment: Costs for hardware and software enabling card payments, such as POS terminals.
Components of card payment analytics
“Card payment analytics” refers to a process of collecting, aggregating, analysing and interpreting credit or debit card transactions. This data can be used to understand a customer’s portfolio, monitor sales, detect fraud and measure a product’s performance. The following describe the enterprise product of card payment analysis from a financial institution’s perspective.
A deep dive into transaction analysis
Starting with basic descriptive data analysis, we analyse overall spending, sales of equipment and services and revenue generated by a merchant for a bank.
-
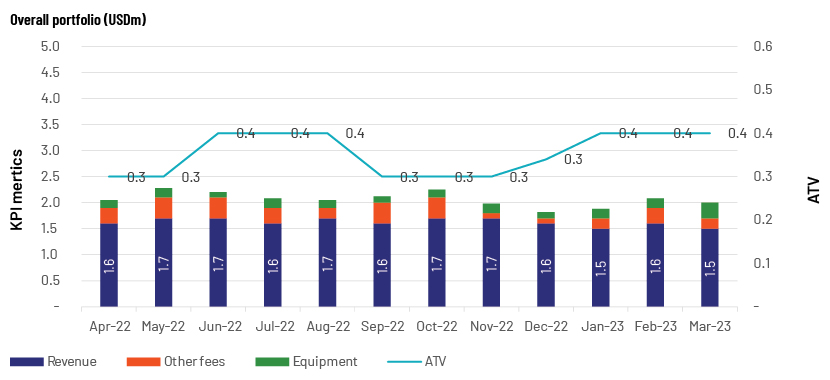
Transaction monitoring:
This refers to tracking and analysing transactions at a merchant and keeping a close watch for deviations from established patterns. We use line or bar charts to analyse patterns such as spending amounts, average ticket volume (ATV) and revenue generated.
The following are examples of how a business gains insights by analysing transaction data m/m and YTD.
1. M/m comparison:
 Source: Acuity Knowledge Partners
Example 2: M/m comparison of spending and transactions
![]()
Source: Acuity Knowledge Partners
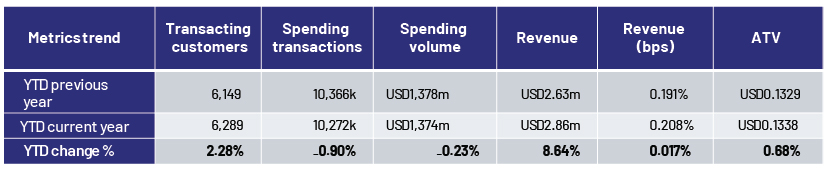
2. YTD comparison:
Assessing data from the beginning of the year to date helps in performance evaluation and decision-making.
Example 1: YTD comparison of active customers, spending transactions, revenue and ATV
Source: Acuity Knowledge Partners
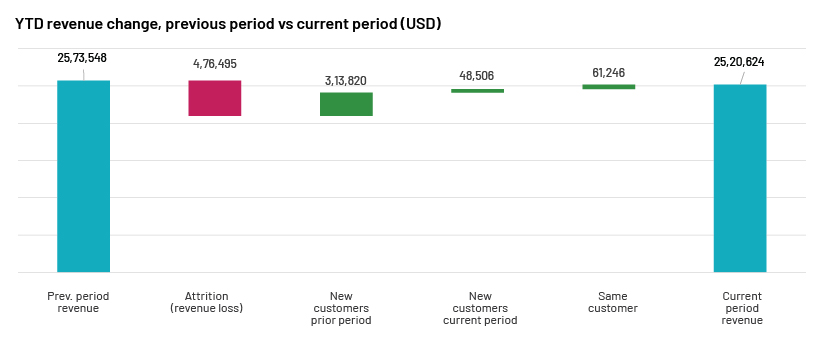
3. Waterfall analysis:
This is a financial modelling technique used to analyse the sequential impact of gains and losses on a given outcome, presenting a step-by-step breakdown of changes.
Example 1: Overall YTD revenue shows a decline of c.USD0.05m (the difference between the first and last bars, in blue); a revenue loss of c.USD0.5m due to customer attrition (second bar, in red); new customers in the current period show very slow revenue growth, by c.USD0.26m, compared with the previous period (third and fourth bars, in green); repeat customers show growth of c.USD0.06m in the current year (fifth bar, in green).
Source: Acuity Knowledge Partners
We can further analyse this by segments such as customer category, sector, spending bucket, seasonality and pricing method.
Customer attrition:
Customer attrition has always been a key challenge for business and affects the merchant-acquiring sector as well. Merchant acquiring is a highly competitive market, with each acquirer focusing on winning larger market share than peers’. Traditional acquirers face more challenges now – not only from similar acquirers but also from new fintech players who have won over merchants with fast turnaround times, improved technology, and value-added services. Competitors, especially new fintech firms, are pleased to bridge the gap left by traditional merchant acquirers and the card issuers they partner with.
Payment analytics help to flag customers who leave and to report this to relationship managers, so they can identify the reason for customers leaving.
Example 1: M/m revenue attrition as a percentage of the merchant-acquiring sector
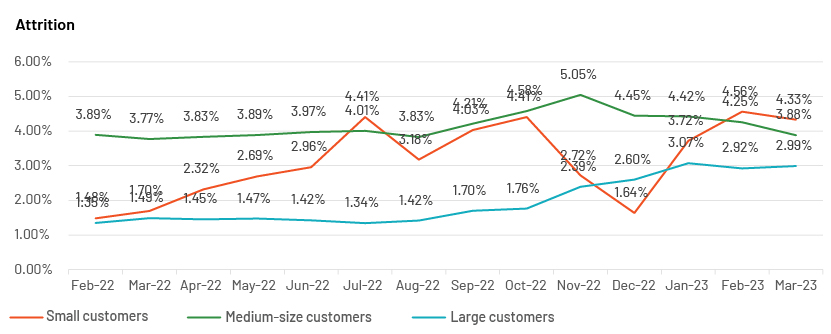
Source: Acuity Knowledge Partners
Example 2: M/m spending attrition as a percentage of the merchant-acquiring sector
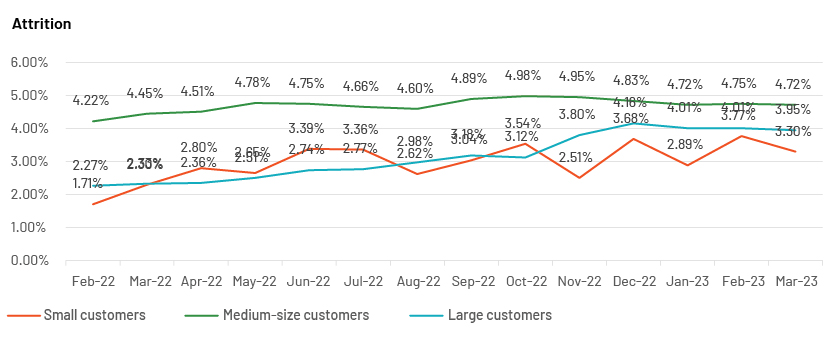
Source: Acuity Knowledge Partners
Example 3: M/m merchant attrition as a percentage of the merchant-acquiring sector
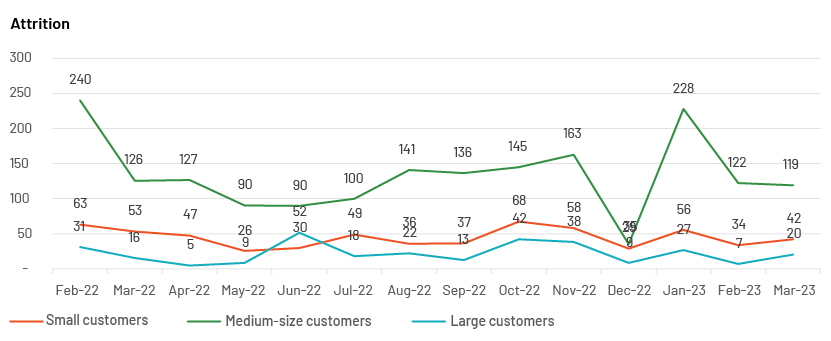
Source: Acuity Knowledge Partners
How Acuity Knowledge Partners can help
Our commercial regional banking institution clients leverage our expertise in data curation and analytics, deploying our financial services technology consulting services as extensions of their in-house teams. We provide efficient, scalable, flexible and seamless solutions for payment analytics, combined with data accuracy, for effective decision-making relating to merchant portfolios.
Frequently Asked Questions
1. What is card payment analytics?
Enterprise product of Card Payment Analytics involves analysing data from card transactions to uncover trends, enhance decision-making, and improve operations. It examines key metrics like spending behaviours, fraud detection, customer segmentation, and merchant performance. This process helps businesses optimize marketing strategies, manage risks, and enhance customer experiences. By using advanced tools such as machine learning and data visualization, Card Payment Analytics provides actionable insights that support revenue growth and operational efficiency.
2. How has card payment analytics evolved over time?
Card Payment Analytics has progressed from basic transaction tracking to delivering advanced insights through AI, big data, and machine learning. Initially limited to simple reporting, it now supports real-time fraud detection, customer segmentation, and predictive analysis. The adoption of cloud computing has improved scalability and efficiency. Today, it plays a key role in enhancing customer experiences, strengthening security, and enabling omnichannel strategies, reflecting the increasing reliance on digital payments and the demand for smarter business solutions.
3. What role does machine learning play in payment analytics?
Machine learning enhances payment analytics by detecting fraud through anomaly detection and analysing transaction patterns. It helps businesses segment customers based on spending behaviour, enabling personalized offers and experiences. Machine learning also supports predictive analytics, forecasting trends, and optimizing operations. By automating complex data analysis, it enables real-time decision-making, improving efficiency, security, and customer satisfaction. Ultimately, machine learning empowers businesses to make smarter, data-driven choices in payment processing.
Sources:
-
https://www.paymentsjournal.com/solving-the-merchant-attrition-problem/
-
https://corporate.payu.com/blog/what-merchants-need-to-know-about-payment-analytics/
-
https://www.jdpower.com/business/press-releases/2024-us-merchant-services-satisfaction-study
-
https://www.fsstech.com/resources/2020-01/FSS_Paynalytix_(Single_Page_PDF).pdf
-
https://staxpayments.com/blog/7-ways-to-use-payment-analytics-to-grow-business/
What's your view?

Thank you for sharing your Comments
Share this on


About the Author

Over 13 Years of experience in card payment, insurance price comparison and US health and welfare domain with data engineering, ETL, data validation & debugging, process automation and performance tuning. At acuity, leading the client offshore team of payment analytics, mentoring team members, providing audit reports with rigorous data validation of data mart, developing solutions in SAS and google cloud platform. Prior to joining acuity in 2017, I worked as database tester with UK's leading insurance company under its Indian sub-division for insurance price comparison website.
 Blog
Blog
Activist investors – mapping the current lands....
The landscape of shareholder activism In the world of activist investing, a crucial debat....Read More
 Blog
Blog
Technology a catalyst for future deals....
Technological advancements have made past ways of transacting obsolete. Trends are changin....Read More

Like the way we think?
Next time we post something new, we'll send it to your inbox