
Published on December 4, 2020 by Arjun R D
Overview:
In April 2020, the US personal savings rate (the ratio of personal savings to disposable personal income) hit a record high 33.6%, according to the US Bureau of Economic Analysis. The previous record savings rate was 17.3%, in May 1975. Spending declined by a record 13.6% in April 2020.
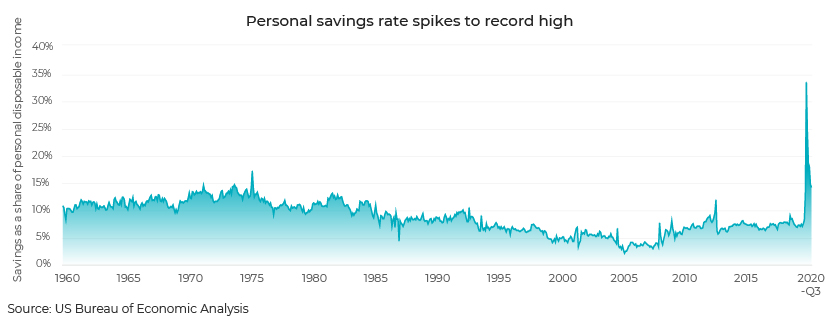
Economic uncertainty due to the COVID-19 pandemic, coupled with less opportunity for people to go out and spend, is the primary reason for this increase in savings. In six months, USD2.4tn was added to deposits, with USD900bn channeled to the top four banks. Bank of America, which covers half of all American households, said that checking accounts had 30-40% more money in them as of mid-2020 than they did 12 weeks before.
The personal savings rate started picking up slowly after 2005 and gathered pace after the Great Recession. Personal savings grew annually, on average, by 6.3% from 2010 to 2018, higher than the 4.2% rise in disposable personal income during that period.
Prior to the pandemic, baby boomers (who are closer to retirement) were spending less and saving more. This trend is likely to continue, as they make up one of the groups most at risk of contracting the virus.
Growth of digital channels:
Prior to the 2007 financial crisis, banks depended on their extensive branch networks to acquire and serve customers. However, there has been a significant shift toward the digital channel over the past decade. A recent industry study showed that while deposits at the 25 largest US retail banks have doubled over the past decade, the banks’ combined branch footprint declined by 15%. This reverse correlation is even sharper at the top five US banks – while reducing the number of branches by 15%, they increased deposits by 2.6x. Banks shifting from physical to digital channels for customer acquisition have 2-3x lower acquisition costs.
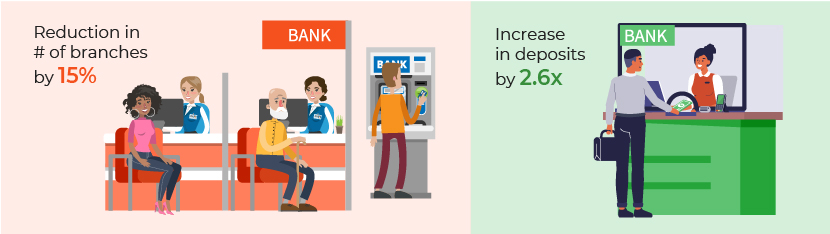
This trend is mainly due to the increase in customer willingness to purchase banking products online or on mobile devices. However, actual digital sales are still far behind, and banks looking to grow in this competitive environment have a significant opportunity in this area, considering that amid the pandemic, the preference for digital channels is stronger than ever.
Digital marketing:
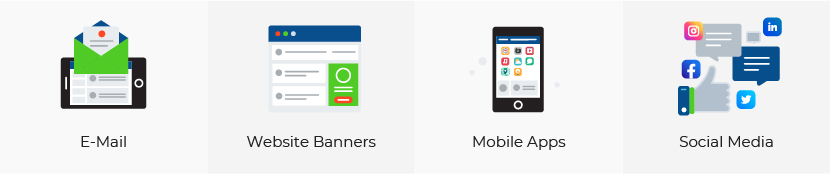
We believe the best way to market a bank’s digital capabilities is through digital marketing, via options such as email, website banners, mobile apps and social media.
Customer loyalty has declined recently as customers shift to those companies providing the best customer experience. Banks looking to increase cash flow into their deposit products can leverage digital channels to acquire new customers. They could also do this by increasing the share of wallet of existing customers.
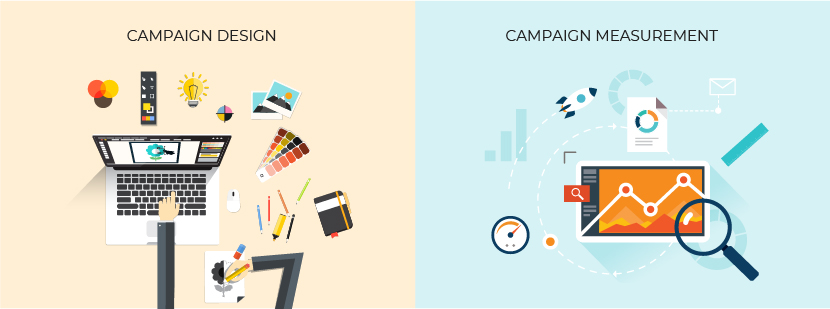
The first step in digital marketing is to have a clear objective on which the campaign will be designed. The target audience needs to be identified subsequently (for more details on the definition of a target audience and segmentation, please see our blog Data-driven campaigning).
Campaign measurement analytics:
Setting up the right campaign measurement system to track the success or failure of a campaign is as important as designing a campaign. A good measurement system will address the following questions:
-
Is the campaign reaching the intended audience?
-
Which creatives are getting more attention and among which group?
-
Which marketing channel is doing well and is more cost-effective?
-
What is the Return on Investment (ROI), i.e., how much money has the campaign brought in to deposit products compared to the amount spent on marketing?
Any bank with a sizable marketing budget would want to know whether its campaign is reaching the right people and bringing in more money as deposits. The analytics would provide more insight on the campaign that could be used in future campaigns to increase ROI.
The measurement system can be broadly divided into three steps based on the stages of a campaign. Although there may be some overlap among the three, the primary steps are as follows:
-
Campaign effectiveness analytics– during the campaign
-
Channel effectiveness study – immediately after the campaign is concluded
-
ROI measurement – at a specified time after the campaign is concluded
1. Campaign effectiveness analytics
The aim is to understand which creatives are doing well and how to leverage this information to increase the campaign’s reach/viewership. AB testing methodology can be used for this purpose.
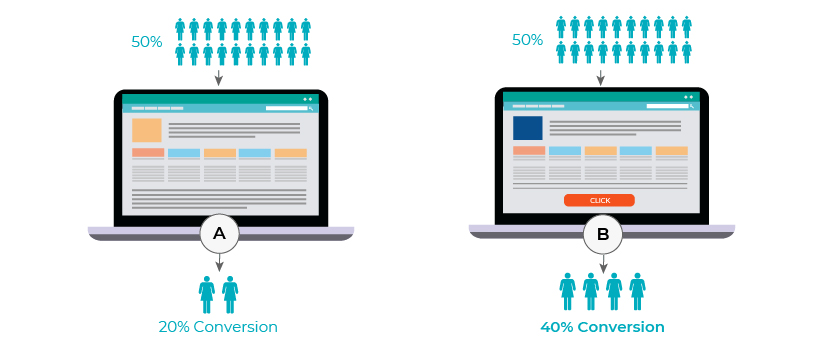
a) For example, there are two different website landing pages, and we would like to know which of these is performing well. The pages will be shown to two sets of people. Based on metrics such as time spent on the website and the website journey followed, the better-performing landing page is identified and shown to more users, increasing the effectiveness of the campaign
b) In the case of email marketing, metrics such as the open rate, click-through rate (CTR) and bounce rate are more helpful
2. Channel effectiveness study
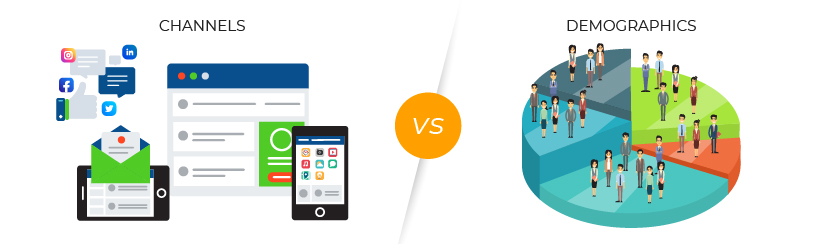
Banks could use many channels, such as email, websites, mobile apps and social media. A channel effectiveness study helps identify which channel is performing well. There are many variables to consider when choosing a channel, for example, the target audience’s age, occupation and location. For instance, mobile apps and social media are popular among Millennials, but baby boomers/Gen X would prefer email and websites. The process could be overwhelming due to the number of channels to choose from and target customer/prospect demographics to consider. Analytical tools could simplify the process; these range from simpler exploratory or inquisitive analytics to more sophisticated marketing mix modelling techniques.
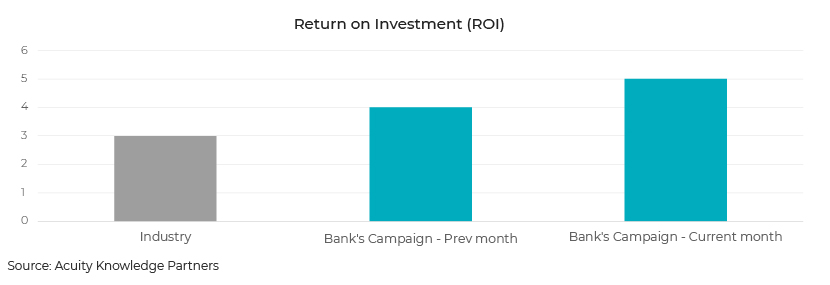
3. Return on Investment (ROI) measurement

The ROI measurement technique used depends on whether it is for new customer acquisition or increasing the share of wallet of existing customers. ROI is ideally measured at a specified time after the campaign is concluded. If the campaign covers a number of days, unlike email marketing, ROI could be measured during the campaign as well.
a) Acquisition of new customers
We need to have baseline numbers from the industry to see if the cash brought in by the campaign is on par/less/more. Comparisons can also be made based on past campaigns. Statistical tests such as t-tests could be used to check whether the difference between the money brought in by this campaign vs the baseline number is statistically significant.
b) Increasing the share of wallet of existing customers
Two techniques can be used for this purpose:
-
-
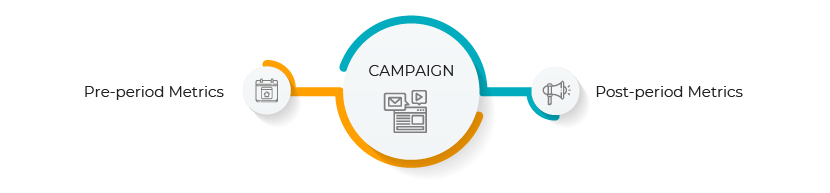
Pre-campaign and post-campaign analysis
At specified periods before and after the campaign (3/6/12 months), the money brought in by customers targeted by the campaign is compared. Any significant difference can be measured using statistical tests such as paired t-tests. The challenge with this technique is external conditions, for example, economic scenarios, which are unlikely to be similar before and after the campaign. Such details need to be factored into the measurement.
-
Treatment and control group analysis
A treatment group is a set of existing customers who were part of the campaign. A control group is a set of customers who were not exposed to the campaign.
The control group selected has to be very similar to the treatment group in terms of demographics (such as age and gender), asset size, relationship with bank (such as share of wallet and the number of products owned). These two groups can be compared to see how much money they brought in to the deposit products during the specific time frames, before and after the campaign. Again, statistical tests such as t-tests can be used to measure the significance of the difference. The ratio of money brought in by the treatment group vs that brought in by the control group is termed “lift”.
This method overcomes the issue of external factors at play in pre-campaign and post-campaign analysis, as both groups are subject to the same external factors.

The techniques discussed above are not exhaustive but merely give a glimpse into the world of campaign measurement analytics.
-
Conclusion:
While allocating sizable marketing budgets for multi-channel campaigns, it is critical to deploy the right measurement systems, as these could be the game-changer in increasing the effectiveness of a campaign and, thus, the overall ROI on marketing spending. The right measurement system would also help us learn from the mistakes made in a campaign, so they could be rectified in future campaigns.
How Acuity Knowledge Partners can help
Acuity Knowledge Partners (Acuity) has been providing research and analytics services for over 18 years to more than 300 buy-side and sell-side firms globally. Our dedicated data science practice was launched in 2019, supported by 15 years of experience in providing quantitative and technology solutions to our clients. Acuity’s data science team of over 70 professionals works closely with 220 technologists and 2,000 analysts to provide digital insights by analyzing structured and unstructured datasets.
Sources:
CNBC (S. savings rate hits record 33%)
Bureau of Economic Analysis (BEA Personal Saving Rate)
Deloitte (Personal savings: A look at how Americans are saving)
McKinsey (Rewriting the rules in retail banking )
WSJ (Coronavirus Has Left Banks With Lots of Cash and Little to Do With It)
Tags:
What's your view?

Thank you for sharing your Comments
Share this on


About the Author

Arjun R D has over six years of experience in providing data analytics for financial services firms. His areas of expertise cover product analytics, sales and marketing analytics, campaign measurement, secondary research, statistical modelling and data visualization. At Acuity, Arjun provides product analytics, business intelligence and bespoke reporting solutions to a leading US bank. Previously, he provided analytical solutions to the sales and marketing practice of a leading asset management firm with over USD3tn in assets. He holds a master’s degree in Management specializing in Finance and a bachelor’s degree in Engineering specializing in Computer Science.
 Blog
Blog
Accelerating efficiency in generating business r....
Reports have a significant impact on the progress of a business. They are the foundation o....Read More
 Blog
Blog
Why customer experience management has become a ....
Customer experience management (CXM) uses deep customer insights to deliver personalised e....Read More
 Blog
Blog
The future of global payments in an era of open ....
For over a decade now, the financial services sector and especially the global payments la....Read More
 Blog
Blog
Applied data science for financial markets
The amount of global economic data that needs to be analysed is likely to reach 150tn giga....Read More
 Blog
Blog
Effective customer lifecycle management (CLM)
Exponential growth in personalisation initiatives, powered by an unparalleled level of acc....Read More
Like the way we think?
Next time we post something new, we'll send it to your inbox