Published on December 13, 2021 by Sweta Khandelwal
Overview
The US economy has witnessed several economic downturns, indicating that economic distress is an inevitable part of the business cycle. The US has experienced more than 30 cycles of contractions and expansions, according to the National Bureau of Economic Research (NBER). The coronavirus outbreak has hurt communities and hampered economic activity, leading to a deep economic depression of indeterminate duration due to business closures, event cancellations and work-from-home regulations.
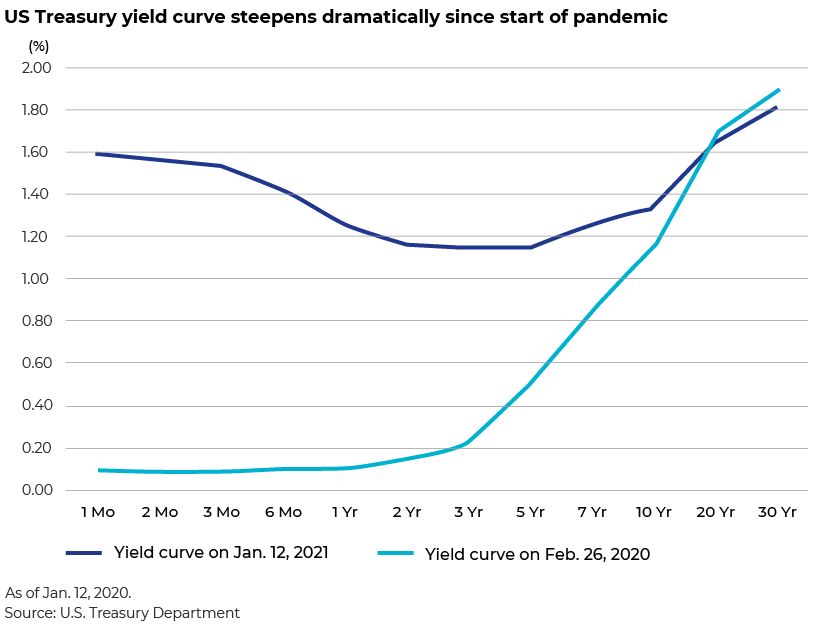
In 2020, the US Treasury market took investors on a rollercoaster ride, with rates plummeting to historic lows early in the year before resuming a gradual climb in the second half.
In this blog, we discuss how a fall in US Treasury rates impacts the economy and leads to recession.
What is the US Treasury rate?
Treasury bills, bonds and notes are loans to the federal government, and Treasury rates are the yields paid by the US government as interest for borrowing money through selling bonds. The US Department of the Treasury sells these to pay off the country's debt. It is important to remember that when demand for bonds is high, rates fall. Treasury yields move in the opposite direction of bond values. For investors and economists, the current Treasury rate is a key benchmark and indicator.
Treasury bills come in a variety of maturities, from a few days to 52 weeks. A Treasury note has a 2- to 10-year maturity, but a Treasury bond has a 20- to 30-year maturity.
The Treasury yield curve (or term structure) is not only the primary mover of all domestic interest rates, but also an important factor in determining global rates in the US. Treasuries, which are debt instruments issued by the US government, drive interest rates on all other domestic bond categories up and down. Any bond or debt security with a higher risk than a comparable Treasury bond must offer a higher yield to attract investors. The 30-year mortgage rate, for example, has generally been 1-2% higher than the yield on 30-year Treasury bonds.
When we consider yields of all Treasury instruments – from one-month bills to 30-year bonds – we see that investors demand more compensation for taking on the extra risk of owning government debt as maturities become longer; hence, yields usually have an arcing, upward slope. A 30-year bond would, therefore, yield significantly more than a one-month bill or a five-year note. Bond yields and bond prices are equally commensurate.
Risk involved in falling US treasury rates – “recession”
The term “recession” refers to a drop in a country’s gross domestic product (GDP). A recession is mainly caused by inflation, speculation, a currency crisis and national debt.
Treasury rates have traditionally been regarded as economic growth predictors and with good reason. Rising yields and a steepening curve – the closely monitored difference between short- and long-term rates – indicate optimism about future growth, but falling yields and a flattening curve usually signal a decline.
The inverted yield curve is an abnormal phenomenon and has historically predicted recessions in the US. Due to this historical association, the yield curve is frequently used to forecast business/economic cycle turning points. An inverted yield curve demonstrates that yields on short-term bonds become higher than those on long-term ones, and a number of investors expect short-term interest rates to fall substantially at some point in the future. In practice, though, recessions frequently result in lower interest rates. Recessions generally follow inverted yield curves.
History of recessions
Prediction of 2008 crisis based on Treasury rates
The yield curve started to flatten in January 2006, indicating that investors did not require a higher yield for longer-term notes. The yield on the 1-year note was 4.38 % on 3 January 2006, slightly higher than the 4.37% yield on the 10-year note. This was the dreaded yield curve inversion. It anticipated the Great Recession of 2008. The yield curve inverted in July 2000, triggering the 2001 recession.
The subprime mortgage crisis triggered a global bank crisis that led to the collapse of the US housing bubble. Even as oil and food prices rose, falling housing-related assets contributed to a global financial crisis. Many of the top financial institutions in the US, including Bear Stearns, Fannie Mae, Freddie Mac, Lehman Brothers and AIG, failed or collapsed as a result of the crisis. The government responded with a USD700bn bank rescue programme and a USD787bn fiscal stimulus programme. In over a year, the NBER proclaimed the recession over.
2012
The 10-year Treasury yield fell to its lowest level in years on 1 June 2012. It fell to a low of 1.47% during the day and closed at 1.43% on 25 July 2012. The lowest point in 200 years had been reached as investors pulled their money out of Europe and the stock market. Investors were concerned about the Eurozone debt issue, the fiscal cliff, the weak employment report and the outcome of the 2012 presidential election.
2016
On 5 July 2016, the yield closed at 1.37%, beyond the record low in 2012, and the UK's decision to quit the European Union worried investors.
COVID-19 pandemic
A number of countries experienced a significant slowdown in growth since 2017, and many European governments faced economic crises. The yield continued to decline after reaching a high of 2.79% on 18 January 2019. The yield curve reversed on 22 March 2019. The 10-year yield was 2.44%, lower than the three-month yield of 2.46%. In other words, investors were more concerned about the economy in three months than they had been in 10 years.
The situation worsened in September 2019, when the Federal Reserve (Fed) was forced to intervene in the repo market after the overnight lending rate surged beyond the Fed's target rate in an effort to keep the economy afloat owing to a liquidity problem. With the start of the pandemic in December 2019, the Fed's efforts began to fail, forcing governments to impose travel restrictions and quarantines, and several companies to close. The original outbreak grew into a global pandemic with devastating economic consequences – more than 24m in the US lost their employment.
The 10-year yield peaked at 1.88% on 2 January 2020 and began falling thereafter. It hit a new low of 1.33% on 25 February 2020. It proceeded to plunge, breaking new lows along the way. It had dropped to 0.54% by 9 March. Due to the uncertainty relating to the pandemic, investors hurried to safety. The yield recovered over the rest of the year, and by early 2021, it had surpassed 1%.
How did the Fed respond to the COVID-19 crisis?
The Fed stepped in with several measures to mitigate the pandemic's economic impact, including pledging up to USD2.3tn in financing to help consumers, businesses, financial markets and state and local governments. It took steps to help stabilise the Treasury markets, as the stated objective was “to support the smooth functioning of markets” for those securities.
1. Repurchase agreements (repos): The Fed's repo operations were greatly extended, with the Fed essentially providing dealers with unlimited quantities of cash in short-term loans secured by Treasuries and other government assets. The Fed had already intervened last year to ease short-term market turbulence, but this cash injection may be many times larger.
2. Security purchases (QE): The Fed has resumed its large asset purchases; this was a critical instrument during the Great Recession, when the Fed purchased trillions of dollars in long-term securities. The current purchases are linked directly to enhancing market functioning, unlike after the Great Recession. The Fed has purchased USD1.45tn in Treasury securities and USD575bn in agency mortgage-backed securities since 9 March. Dealers could build more confident markets and effect intermediate transfers by acting as the opposite side of the trade – the buyer to these sellers.
3. Easing regulations: The Fed has reduced its supplemental leverage ratio regulation for the time being. It permitted the largest banks to, among other things, omit cash and Treasury securities from their total asset calculations, substantially lowering the amount of capital they were required to maintain. Temporarily relieving the balance sheet limits that arguably caused the crisis in the first place could help banks fill the gap when the Fed inevitably leaves. The Fed's initiatives appear to have been successful. Treasury futures are now pricing in line with the Fed’s cash delivery, market depth has begun to improve and repo rates have declined in accordance with the Fed's primary short-term rate objective, the federal funds rate. The Fed's support for Treasury markets, combined with a slew of new emergency lending facilities, has aided the recovery of crucial credit markets.
Conclusion
We can see why US Treasury rates have been considered to be leading indicators of a recession. A recession has a negative impact on the US economy and, in turn, a severe effect on the world economy. A recession is the time between an economic peak and the following lowest point. It generally lasts a short time, but recovery takes a while because confidence has been lost.
The rollout of vaccination programmes is helping economies recover, as has the Fed’s intervention, which has supported the US economy that is now showing signs of improvement in labour markets, consumer demand and asset prices.
How Acuity Knowledge Partners can help
We have multi-sector expertise in the areas of financial analytics and valuation and advisory services. The commercial real estate (CRE) sector is one of our main focus areas, and we have a large team of CRE analysts and subject-matter experts who support global financial institutions, brokers, investment firms and service providers. We provide support across the CRE deal life cycle – from loan origination, lease analysis, loan underwriting and valuation, guarantor analysis, covenant monitoring and testing, post-closing and portfolio monitoring to asset management. Our proprietary suite of Business Excellence and Automation Tools (BEAT) gives you leverage, and we provide you with bespoke products and services tailor-made to your requirements.
References:
https://www.federalreserve.gov/newsevents/pressreleases/monetary20200315a.htm
https://www.thebalance.com/treasury-yields-3305741
https://www.reuters.com/article/us-usa-bonds-yields-yearend-idUSKBN2940H4
https://www.investopedia.com/terms/i/invertedyieldcurve.asp
https://www.brookings.edu/research/fed-response-to-covid19
What's your view?

Thank you for sharing your Comments
Share this on


About the Author

Sweta has over 7 years of experience in working with leading global organizations in commercial real estate lending domains. Her expertise spans a broad range of analyses, including CRE loan underwriting, loan servicing, due diligence, portfolio monitoring, market research reports, and cash flow modelling. At Acuity Knowledge Partners, Sweta is a part of a global insurance firm, providing supporting in the CRE portfolio.
 Blog
Blog
Unveiling the metaverse: the future of real esta....
The metaverse – an overview The metaverse is a new asset class in the digital world th....Read More
 Blog
Blog
Challenges in the CMBS sector, with a focus on t....
Introduction – Distress in CRE and the role of special servicers The special-servicing ....Read More

Like the way we think?
Next time we post something new, we'll send it to your inbox