
Published on October 19, 2020 by Saurabh Mahajan and Shivam Gupta
All eyes are on the 2020 US presidential elections scheduled for 3 November. Considering the US’s economic (contribution of c.15% of global GDP) and military significance, these elections are considered to be one of the most important political events globally. This time around, the pandemic and resulting economic uncertainty have given the elections a new dimension and made the contest more meaningful. Since any new plan or policy requires Congress approval, close attention will also likely be paid to the partisan balance of the Senate and the House. With the Democrats expected to retain the majority in the House, the outcome is likely to be one of following three scenarios:
1. Status quo: President Trump is re-elected but Congress remains divided between a Democratic House and a Republican Senate
In this scenario, current policies will stay as they are. Deregulation will continue, benefiting sectors such as telecoms, energy and financial. Considering the likelihood of spending and tax cuts, the scenario could be most favourable for the financial markets in the near term. However, in the medium to long term, weak economic growth could cause spreads on risk assets to widen. There are added downside risk from growing civil unrest and the pandemic, while on a global level, the US’s dispute with China could escalate.
2. Blue-wave scenario: a Democratic sweep of the White House and Congress
While fiscal policies are expected to remain similar, corporate tax cuts will likely be reversed, implying higher taxes on corporations and individuals in the higher-income bracket. A possible re-regulation of industries could potentially impact the tech, financial, internet and pharmaceuticals sectors. On the other hand, infrastructure spending is most likely to increase. Therefore, while tax regulations could spark volatility following the election results, a spending boost would offer stability to the markets over the medium term. The trade rhetoric would probably be less harsh under Biden, and US foreign policy could take a more tactful approach.
3. Two-out-of-three scenario: Democrat Joe Biden wins the presidency, but the Republicans hold the Senate
This outcome could be difficult for markets. The Senate could block any new stimulus bill if President Trump loses the White House. Policymakers failing to ramp up fiscal stimulus would exacerbate the risk of a double-dip recession, potentially resulting in adverse consequences for the financial markets.
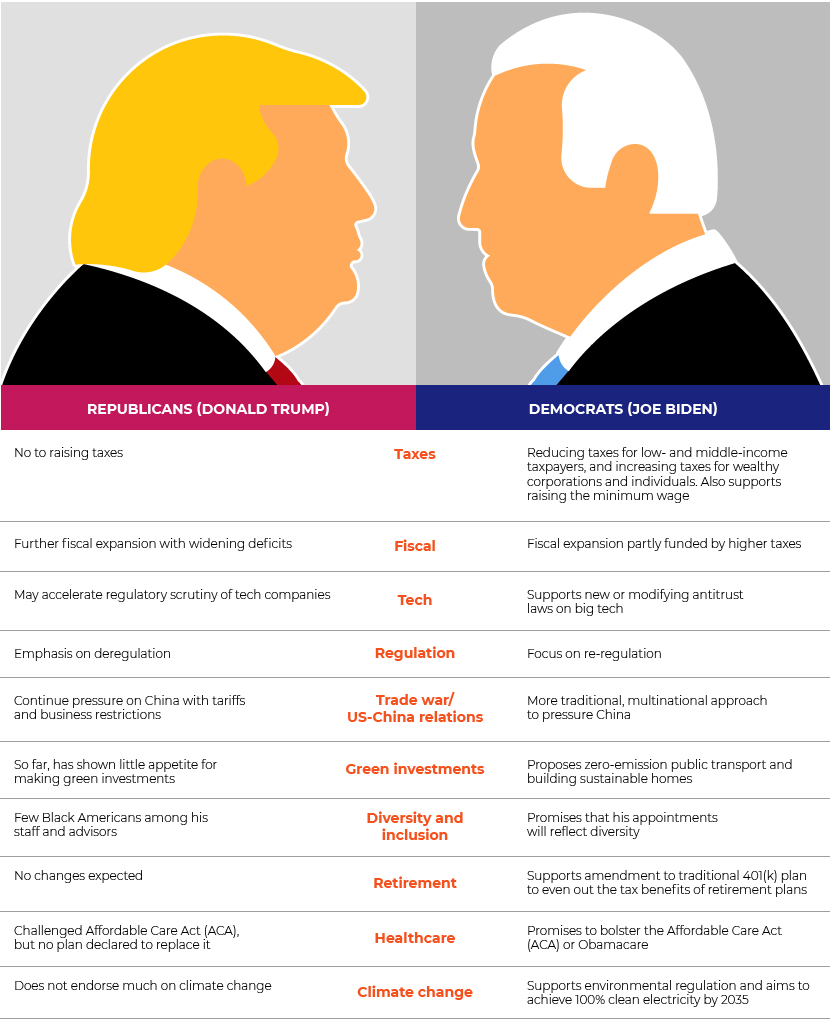
The following table summarises the stand of Trump and Biden on key issues:
Market and sector implications in different scenarios
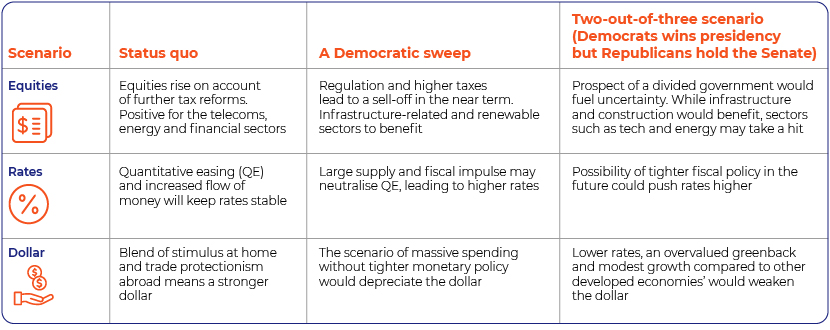
Source:Amundi
Let’s look at the S&P 500’s performance during US elections to gauge patterns
Although past performance is no guarantee of future results, investors generally analyse previous return trends to estimate future performance.
S&P 500 returns in years when US presidential elections were held paint an encouraging picture for investors.
The benchmark stock index has generally witnessed positive performance in election years. The index has yielded positive price returns 17 times in the past 23 times elections were held, translating into a hit rate of roughly 74%. However, these returns have varied substantially, with a 75% spread between the S&P 500’s best election year (1928) and its worst (2008).
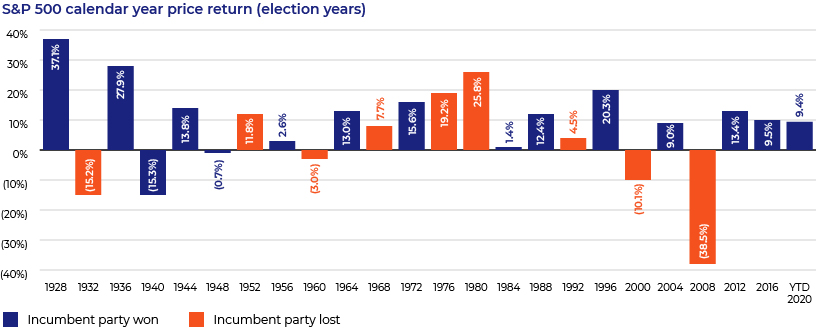
Data from 3 January 1928; YTD 2020 returns until 12 October 2020
Source: S&P Global, FactSet
A victory for the incumbent party is deemed favourable for the markets, as a new administration generally creates uncertainty. The possibility of a significant shift in policies may be a headwind for business and the economy.
Returns in the four years of a US president’s term indicate an interesting trend. The third year of the presidential cycle has generally been the best for stock markets, followed by the fourth, the first andthe second.
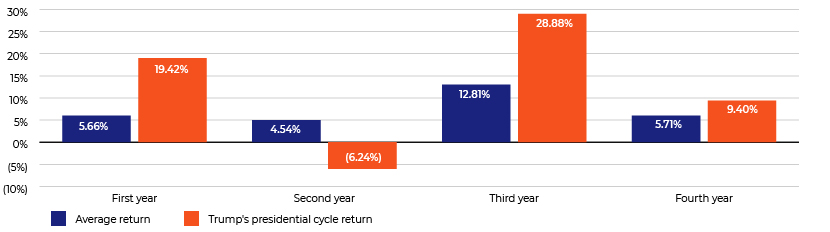
Note: Average returns during US presidential terms starting 1928
Source: Bespoke Investment Group, FactSet
The returns during the third year of Trump’s presidency, i.e., 2019, kept to the pattern, yielding the highest return of 28.9%. However, gains during the fourth year have lagged so far in response to factors including the COVID-19 pandemic, an ensuing recession and mass protests against racial injustice.
The market has rallied more than 70% of the time in each of the last two years of the presidential term since 1928. This pattern makes sense, as incumbent politicians seek to stimulate the economy and markets to increase their chances of re-election.

Note: The figures indicate for how much of the year the S&P 500 has yielded positive returns during each year of a US presidential term, starting 1928
Source: Bespoke Investment Group
There were obvious reasons for the S&P 500 posting negative returns in election years. In 1932, the country was still reeling from the Great Depression; in 1940, markets were hammered by World War 2; in 2000, the dot-com bubble burst; and in 2008, markets were hit by the global financial crisis.
Is it possible to predict the winner?
Stock-market and economic performance have historically served as reliable indicators of the outcome of US presidential elections. Let’s see how:
A. Stock-market performance:
The S&P 500’s performance in the three months before election day has proved to be 100% accurate since 1984in determining the winner, and 87% accurate since 1928.
The incumbent party has retained control when returns have been positive. When the index has declined within the said three months, the opposition tends to take the White House
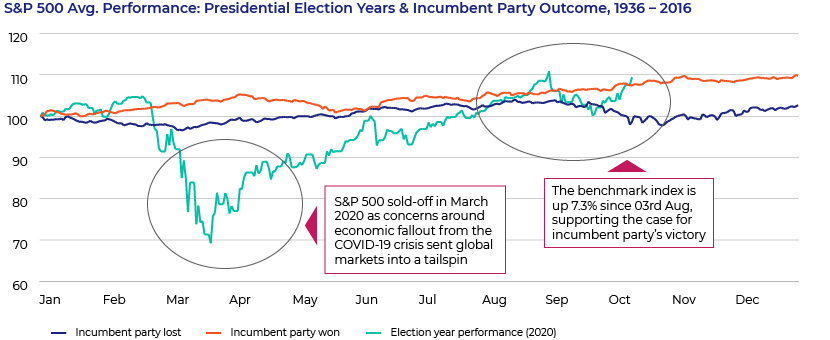
Note: Historical data based on S&P 500 average performance during presidential election years between 1936 and 2016
Source: Strategas Research Partners, FactSet
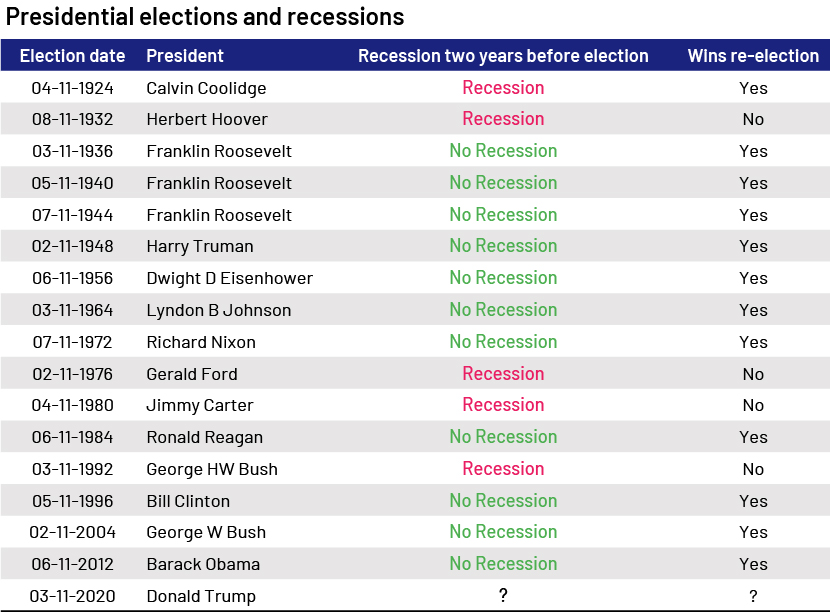
B. Economic performance:
The economy has also been important in deciding the fate of the incumbent president. Since 1920, every president (except Calvin Coolidge) who has managed to ward off a recession in the last two years of his term has been re-elected.
In the second quarter of 2020, the US economy plunged by 31.4%, and even with a record rebound expected in the third quarter, will likely shrink this year.
Source:LPL Financial
Conclusion:
The 2020 US presidential elections are less than a month away, and the outcome is more uncertain than ever. With President Trump diagnosed with COVID-19, the uncertainty has increased further. Both candidates will work to ensure a swifter economic recovery from the crisis, underpinning sentiment in the near term. The risk for investors would come from an unclear or legally contested result that could trigger a period of heightened volatility.
With the S&P 500 offering positive returns in the three-month period before elections, i.e. since 03rd Aug, and where the short recession that hit economy may already be over, the likelihood for Trump’s victory has increased based on past indicators. However, the current COVID-19 crisis has created an exceptional environment around this year’s elections, adding skepticism over the validity of these indicators.
Disclaimer: The views in this blog are the personal opinions of the author and not necessarily those of Acuity Knowledge Partners.
Sources:
https://www.morganstanley.com/ideas/2020-election-forecast-market-outlook
https://graphics.reuters.com/USA-ELECTION/POLICY/ygdpzwarjvw/
https://www.spglobal.com/en/research-insights/articles/sp-500-and-the-u-s-presidential-election
https://www.ai-cio.com/news/3rd-year-presidents-term-best-stocks-report-says/
https://www.foxbusiness.com/economy/wilbur-ross-left-wing-media-trying-to-trigger-a-recession
What's your view?

Thank you for sharing your Comments
Share this on


About the Authors

Saurabh Mahajan is associated with Acuity Knowledge Partners since 2011 and has experience working with investment bankers across the globe. An expert in Debt capital markets (DCM) and M&A, Saurabh has supported clients on a wide range of products such as Market updates and commentary, capital structure analysis, case studies, valuation, pitch books, company and debt profiles, restructuring and distressed debt, to list a few. He also possesses significant exposure to European markets, having worked with regional clients over the years. Saurabh holds a bachelor’s degree in Technology (B.Tech) from Maharaja Agrasen Institute of..Show More

Shivam has around 5 years of work experience in Acuity investment banking analytics team. He has expertise in Debt capital markets (DCM) domain and provides support on weekly bond market updates, market commentary, covenant comparison, debt maturity profiles, league tables, benchmarking exercises and case studies. He supports the DCM teams of a major European investment bank and has developed good understanding of the investment grade and high yield markets on European Markets.Shivam had done MBA in Financial Markets from GGSIPU University and holds a bachelor’s degree in B.A. (Hons) Business Economics from Delhi University
 Blog
Blog
Silver lining to the inflation curse....
When members of the Federal Open Market Committee (FOMC) express vastly divergent views in....Read More
 Blog
Blog
What is replacing the traditional 60/40 portfoli....
For decades, investors have relied on a portfolio combination of 60% equities and 40% bond....Read More
Like the way we think?
Next time we post something new, we'll send it to your inbox